google charts examples

Visualization: Pie Chart

Overview

A pie chart that is rendered within the browser using SVG or VML. Displays tooltips when hovering over slices.


Category

Bootstrap 3.0
img binocular Views: 1660
Creation date 2017

Associated Tags

Without Tags


Related snippets :

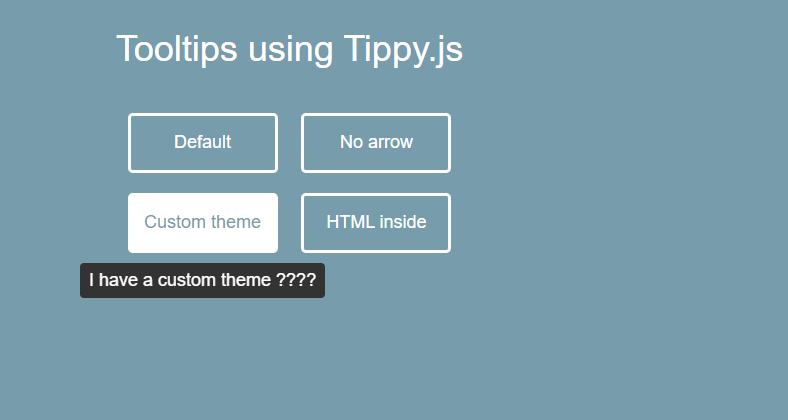
Creative Tooltip Implementations with Tippy.js


Contact Us Page Design in html css


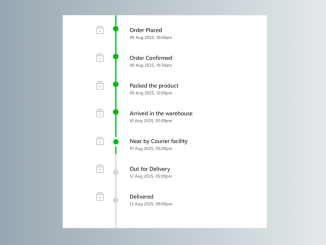
HTML and CSS timeline track orders


Css Html Only Carousel